System Gauge
Your Mac's vital signs. Always visible.
Real-time desktop widgets for CPU, memory, network, disk, battery, and more. Eight stunning themes. Smart alerts. Custom metrics — even AI token tracking.
$4.99 · macOS 15+ · No subscription
Real-time desktop widgets for CPU, memory, network, disk, battery, and more. Eight stunning themes. Smart alerts. Custom metrics — even AI token tracking.
$4.99 · macOS 15+ · No subscription
A native macOS monitoring app built for the desktop. Glanceable, beautiful, and always up to date.
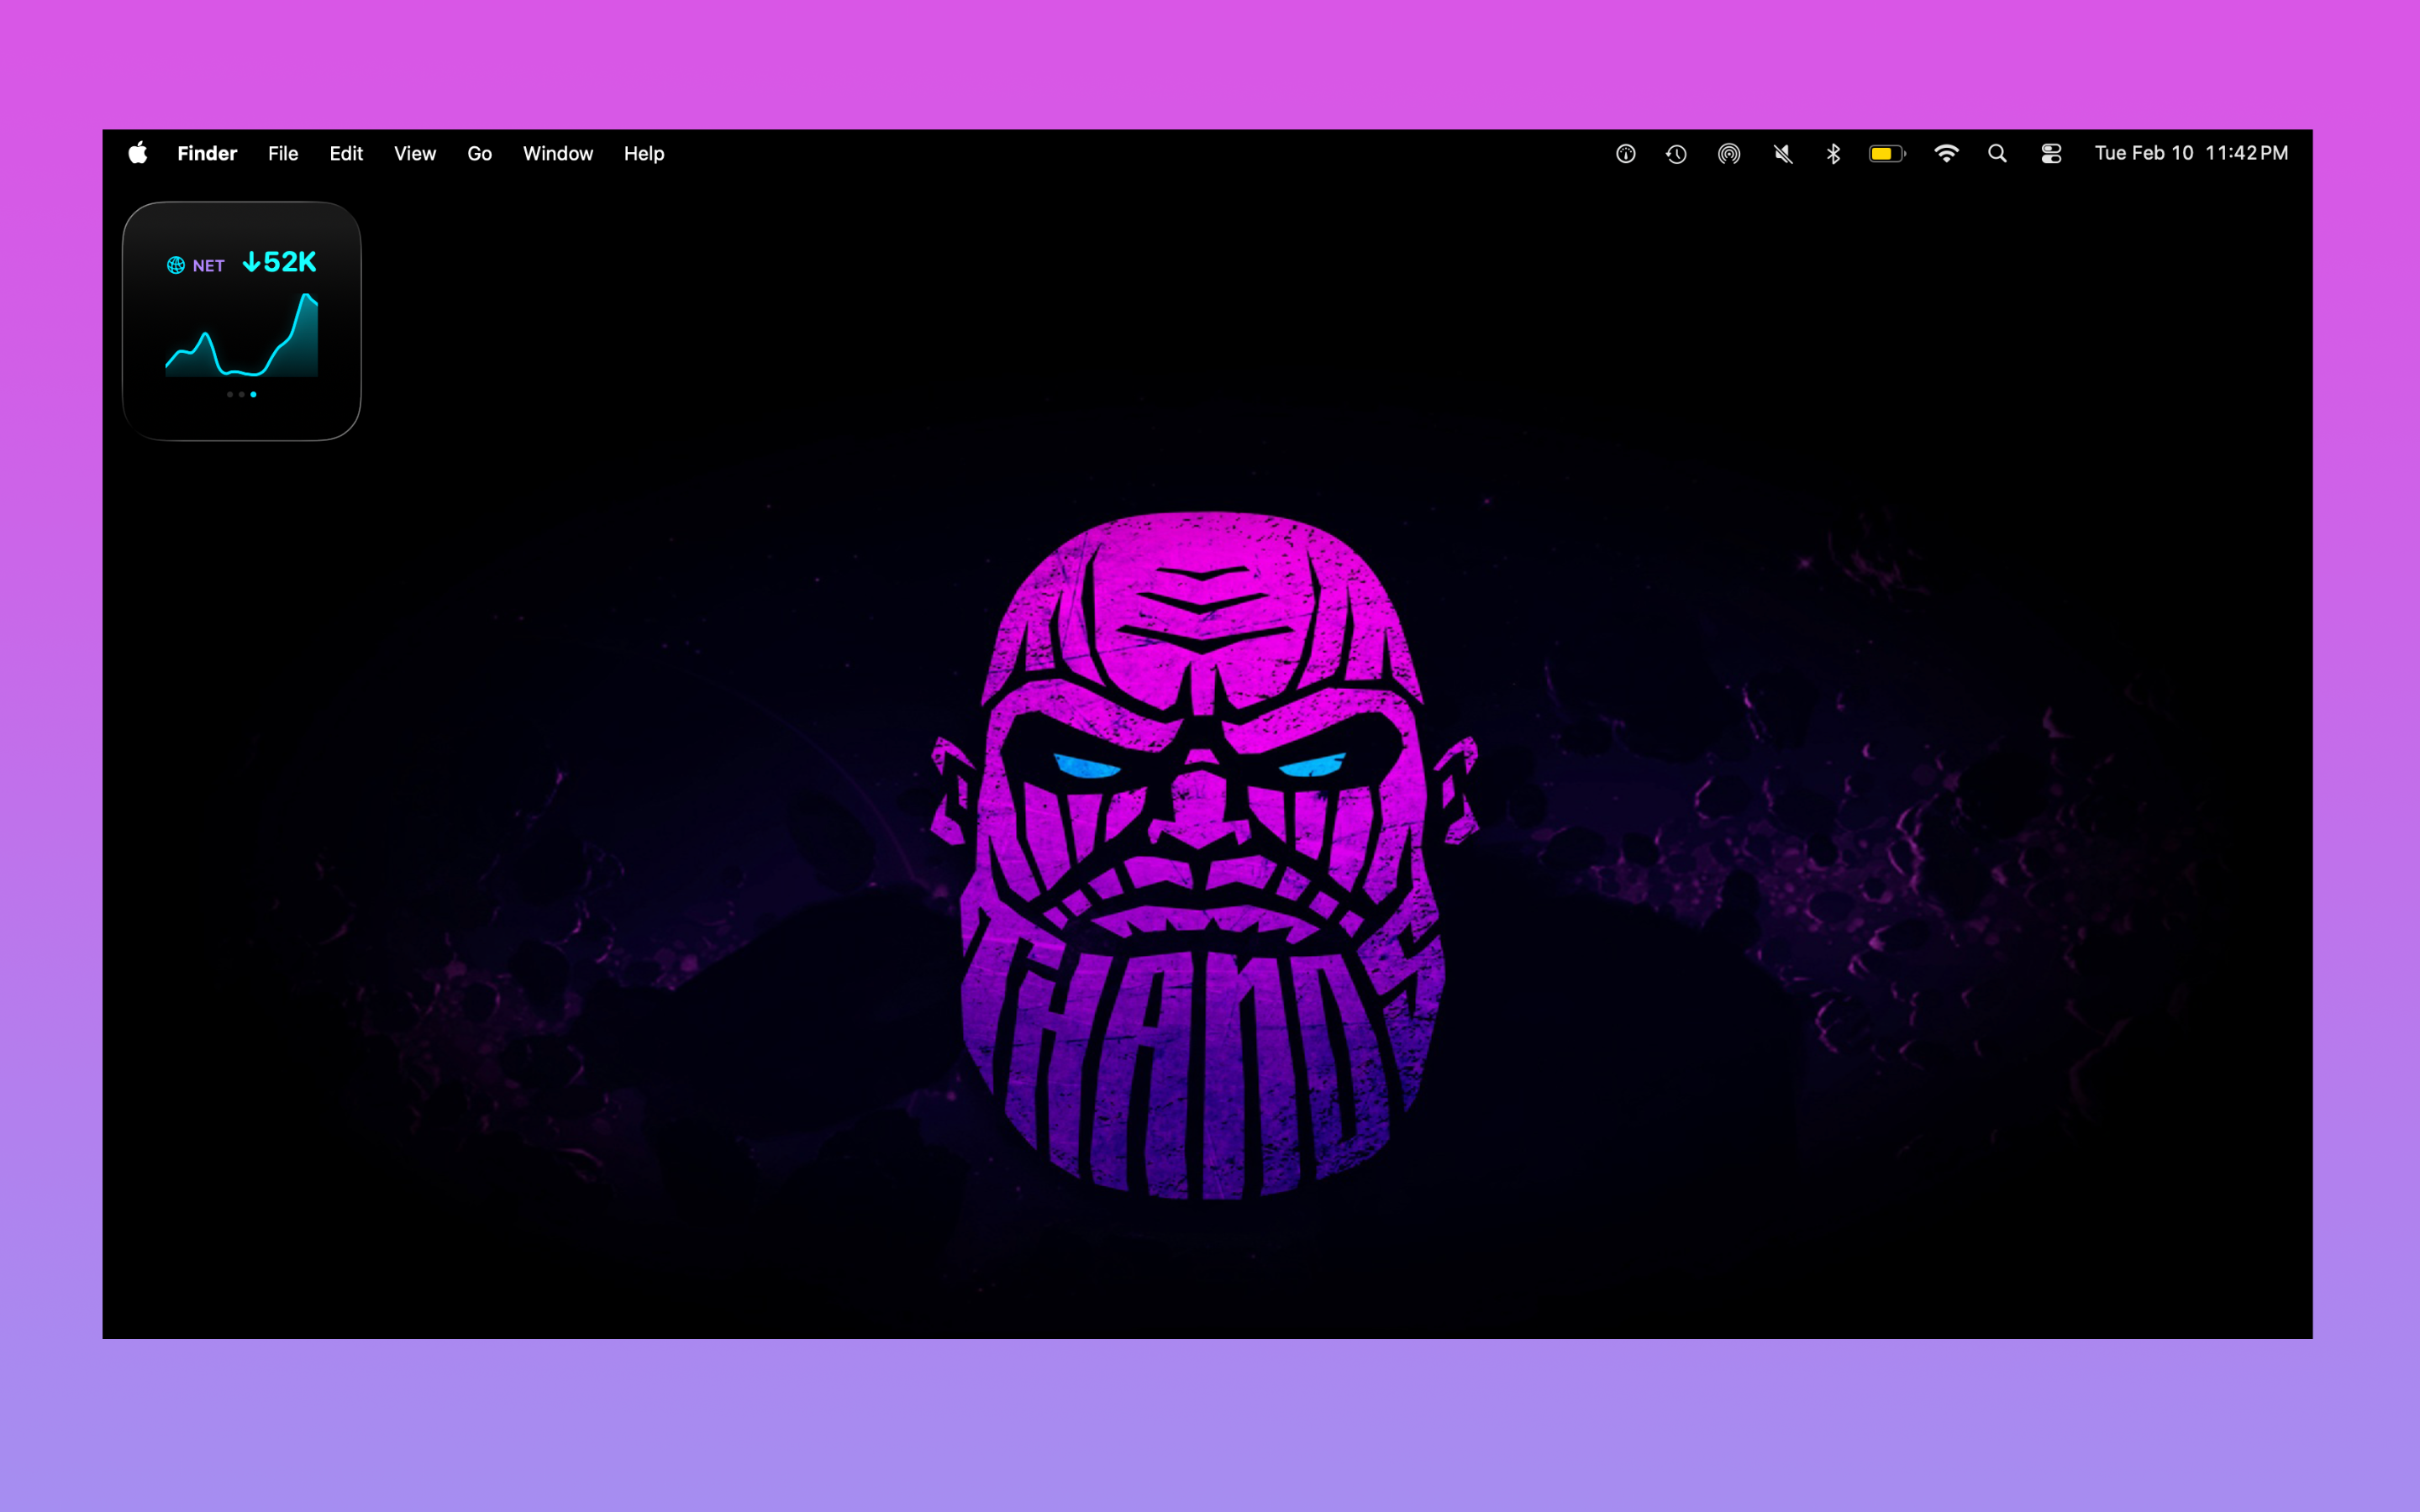
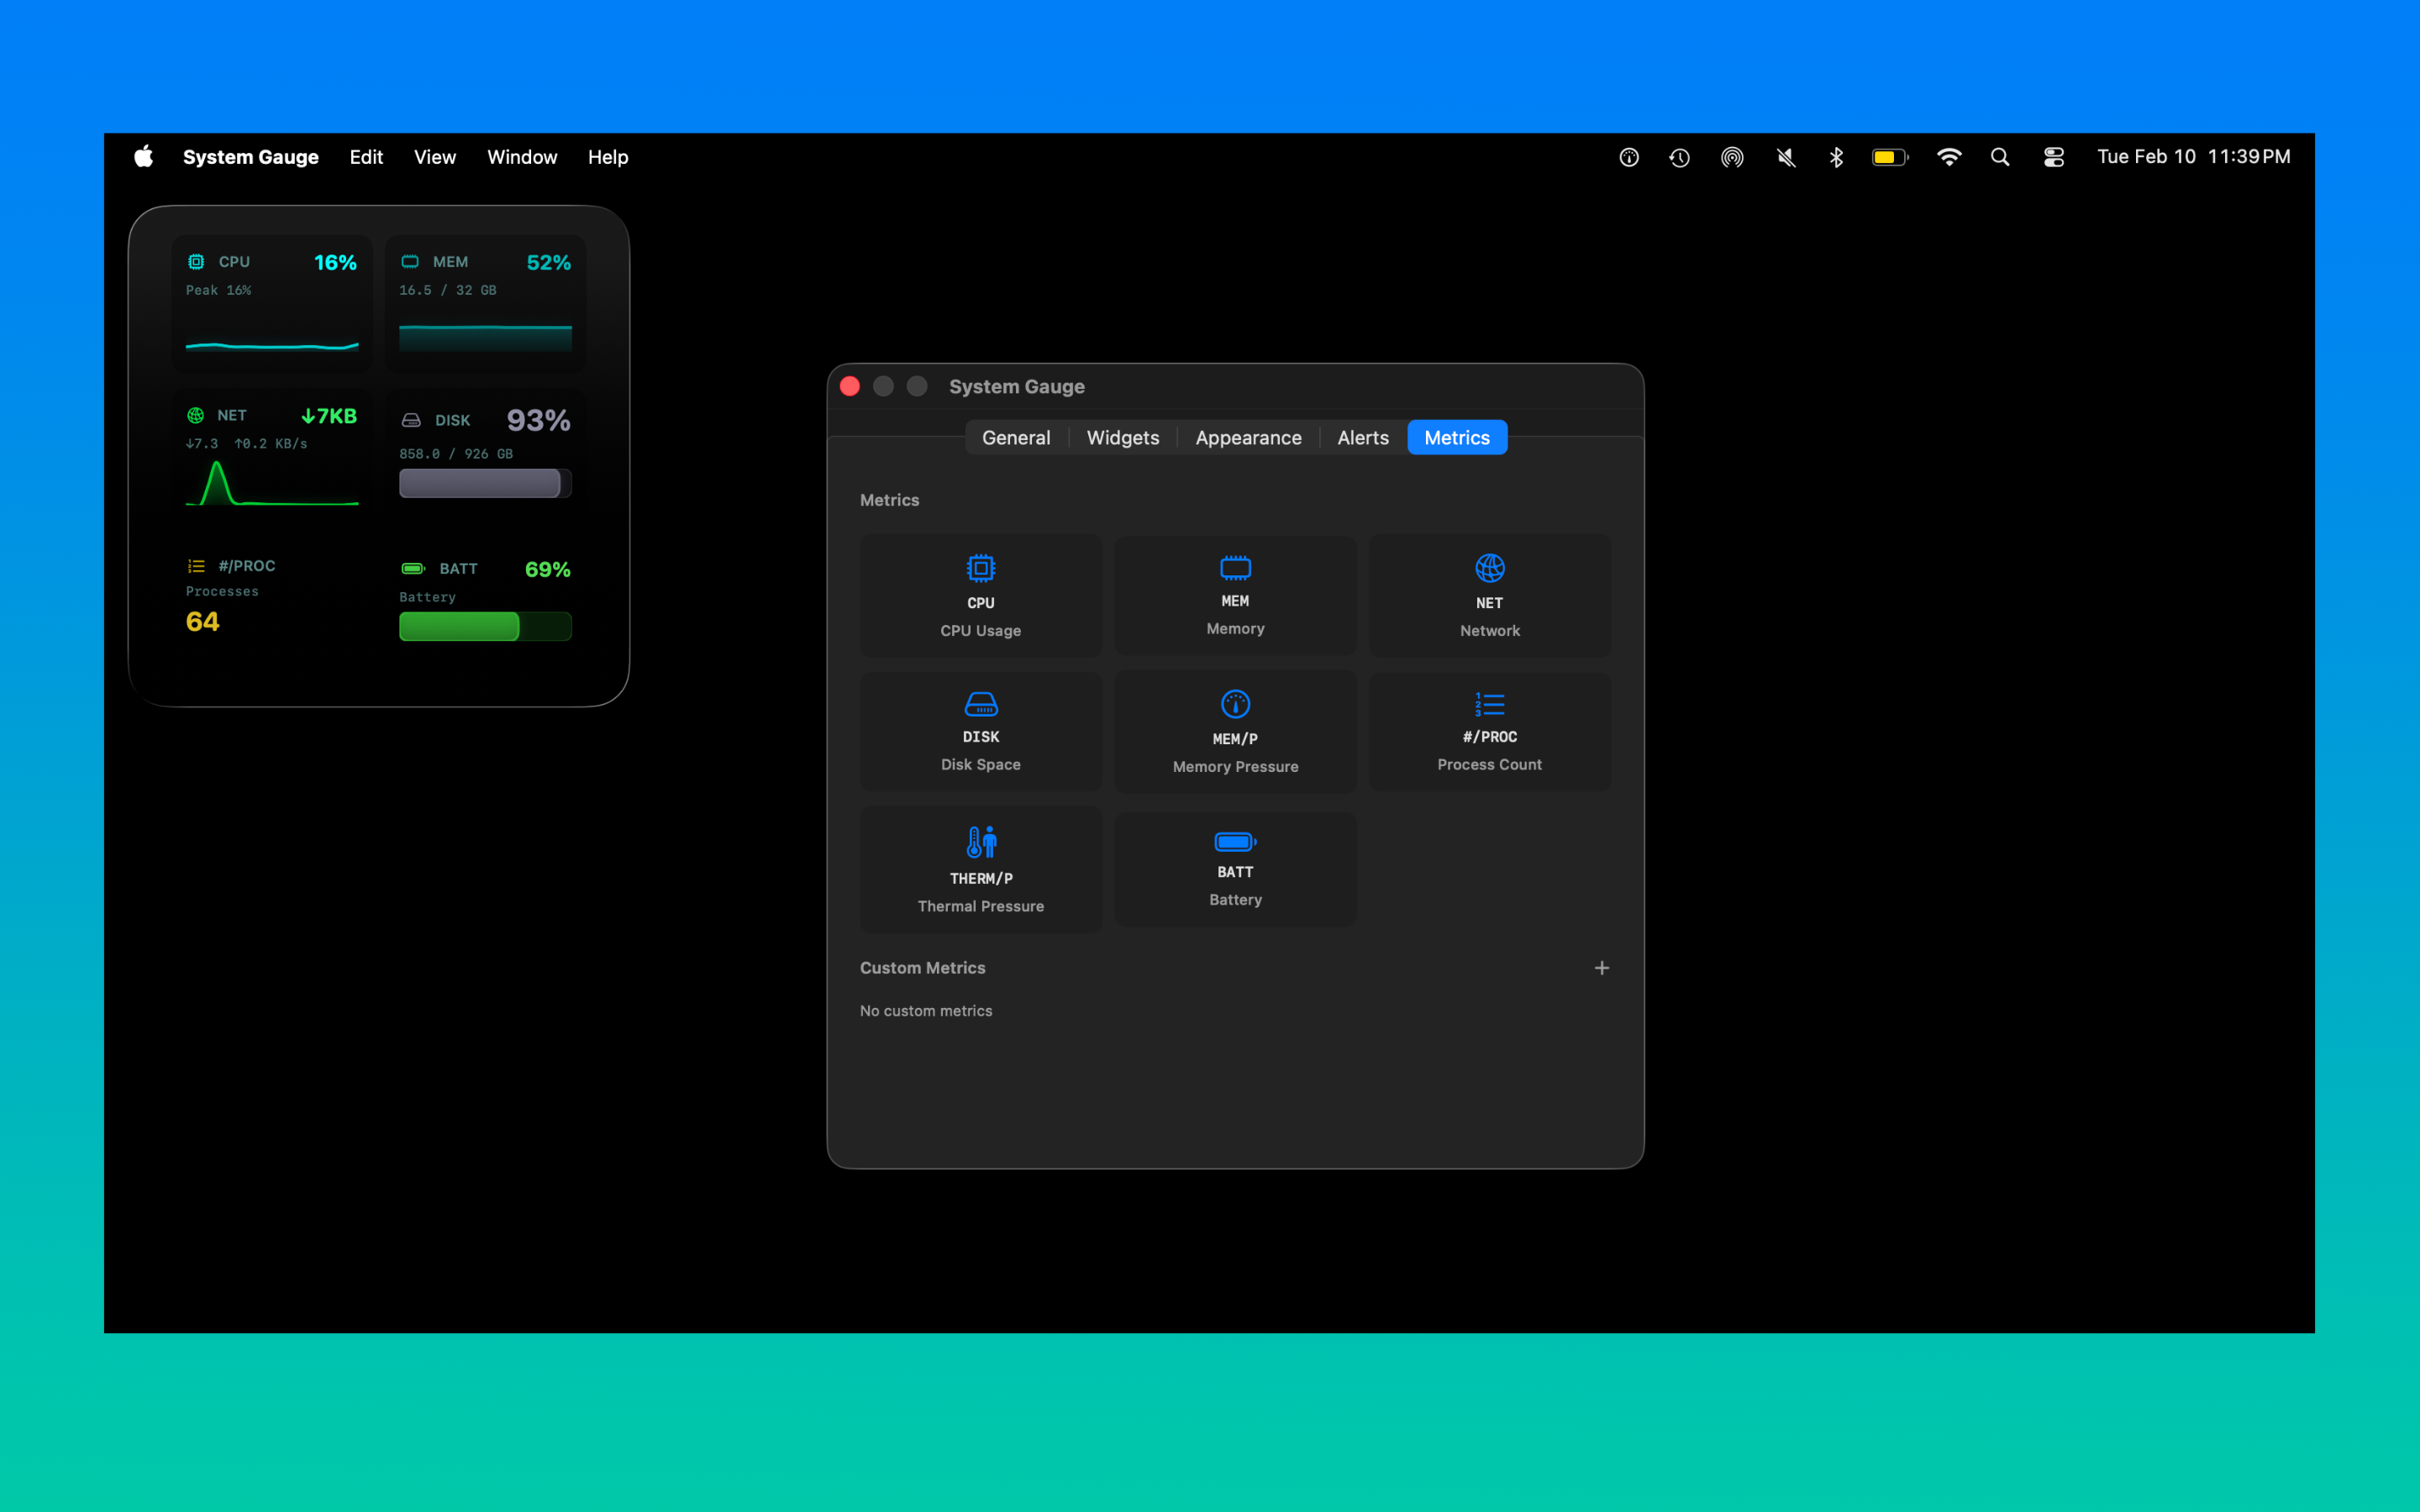
CPU, memory, network, disk, battery, thermal pressure, and process count — all updating live on your desktop.
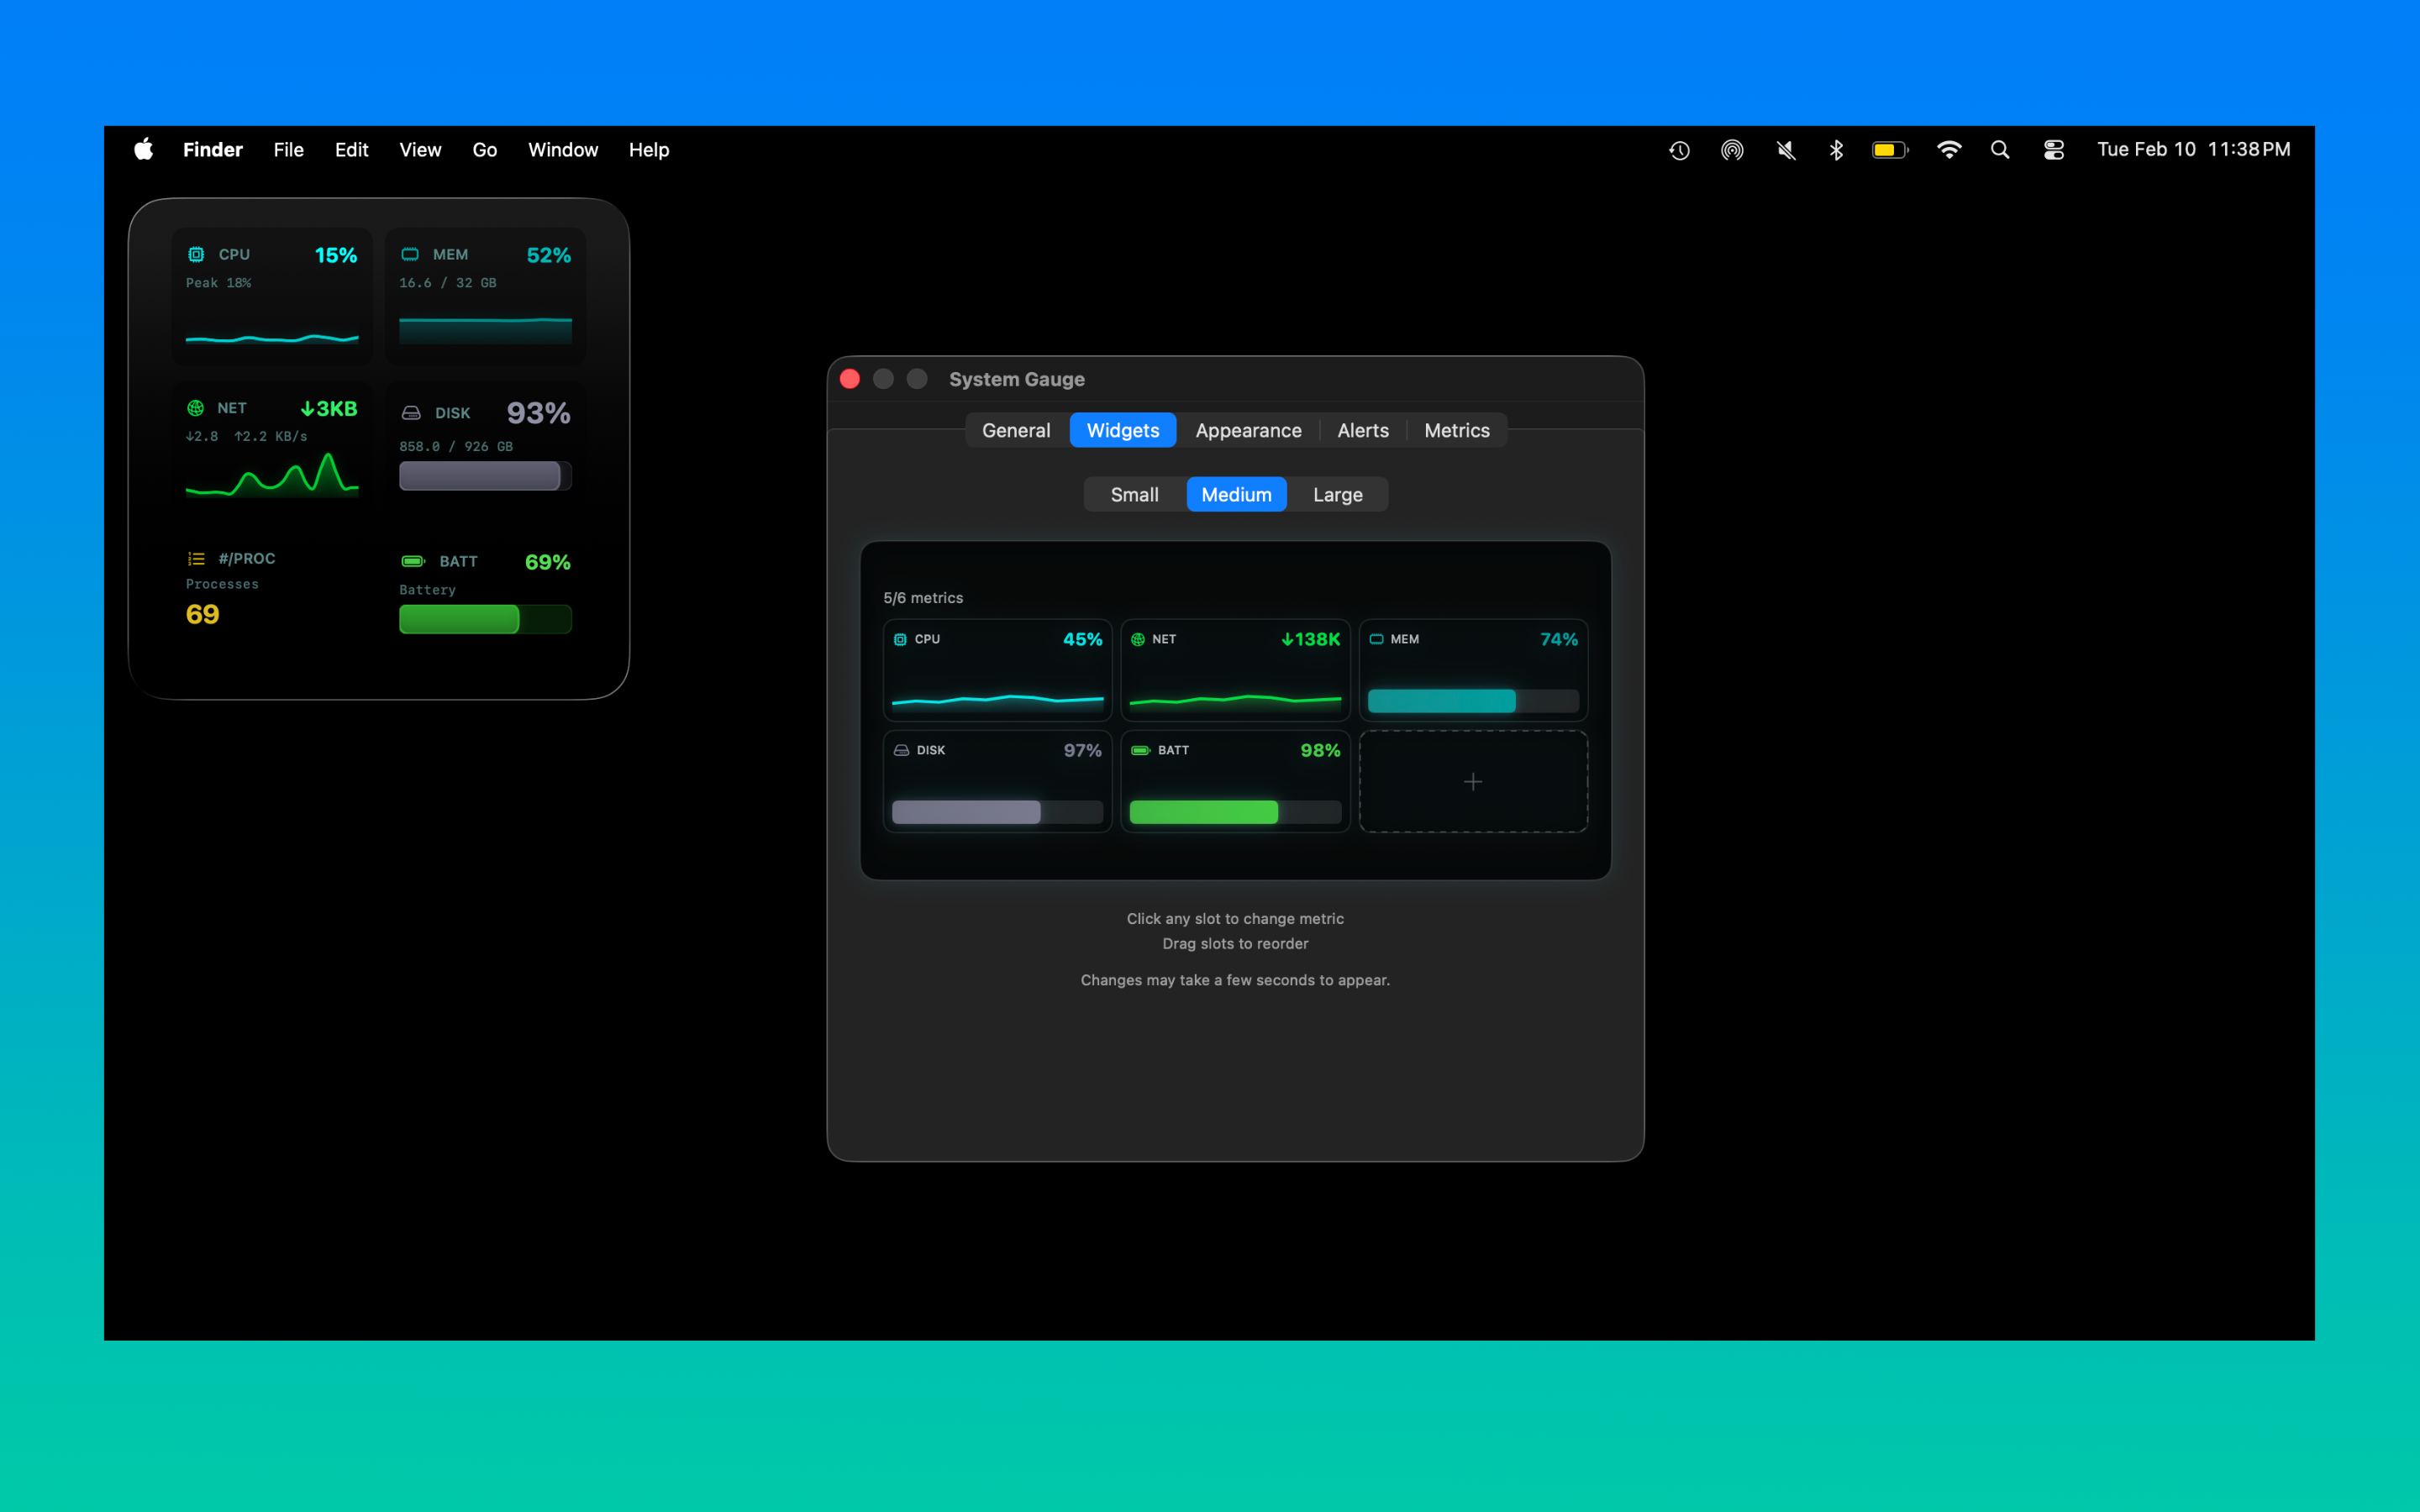
View screenshotSmall, medium, and large widget sizes. Click to change metrics, drag to reorder. Your desktop, your layout.
View screenshotEight built-in themes — ASCII, Matrix, Minimal, Monochrome, Neon, Ocean, Sunset, and Thanos. Or create fully custom themes with the built-in editor.
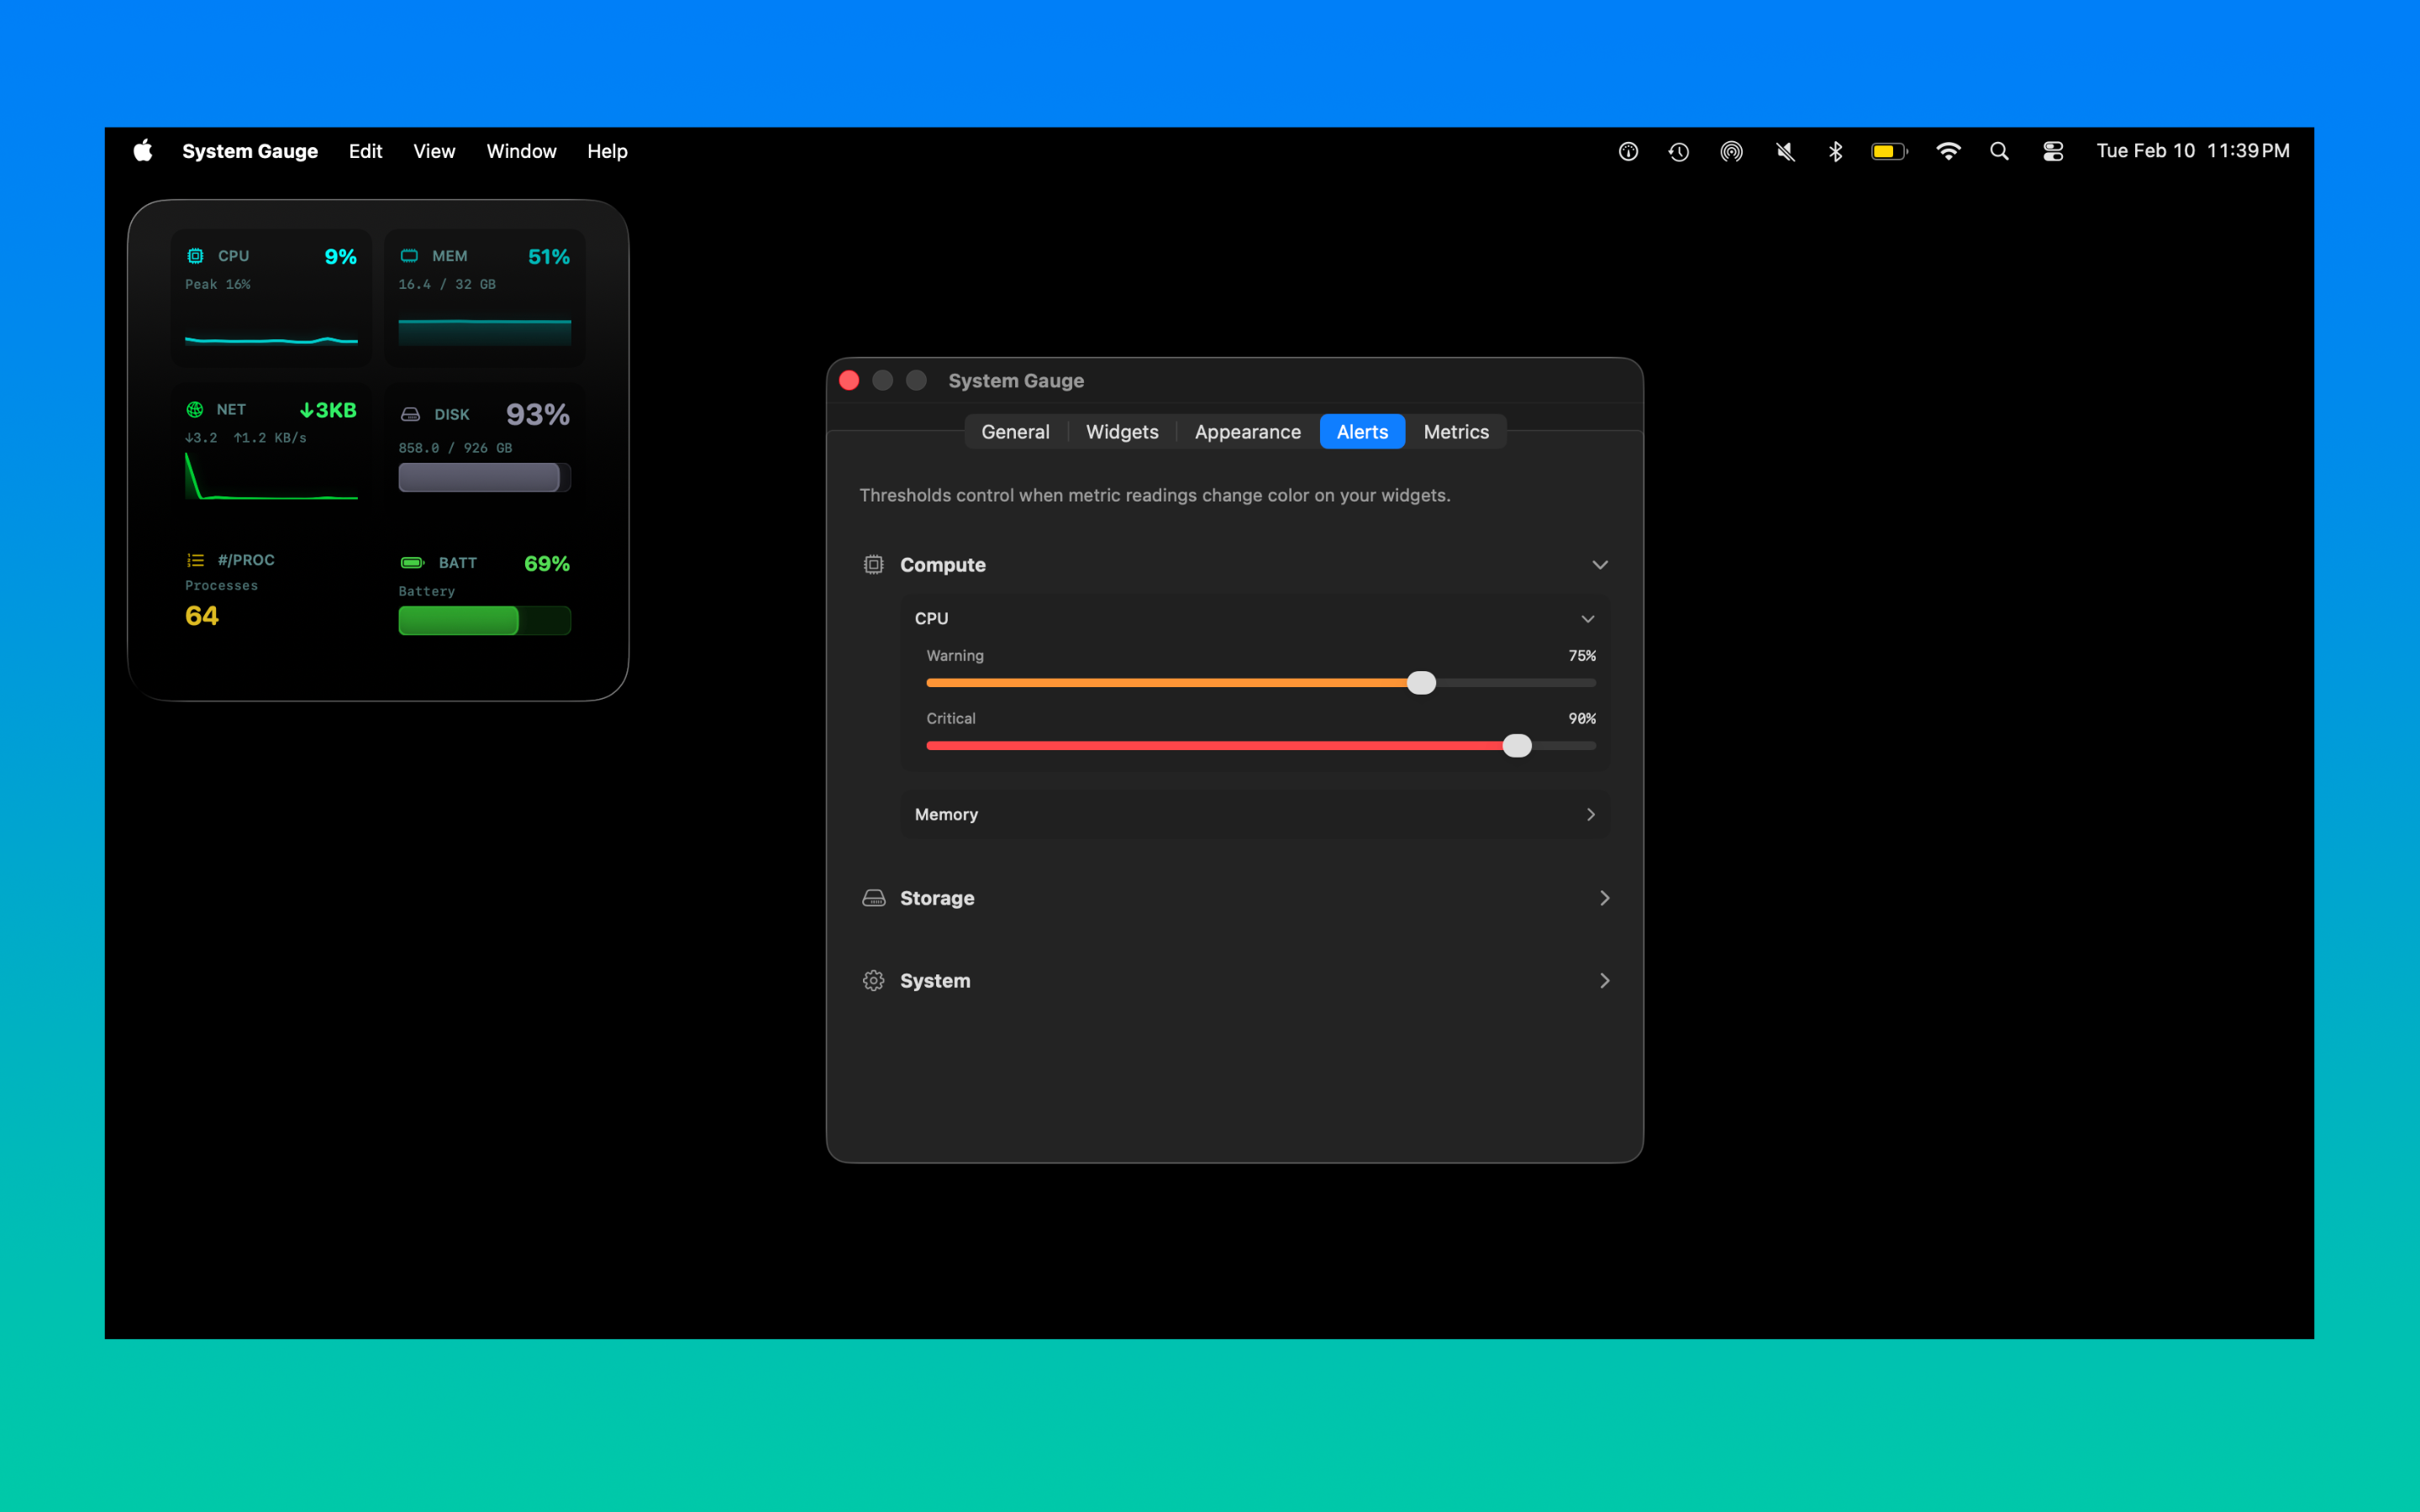
View screenshotSet warning and critical thresholds for any metric. Widgets change color automatically so you spot problems at a glance.
View screenshotGo beyond the built-in set. Point a widget at any local URL that serves a number — AI token usage, API costs, server health, and more.
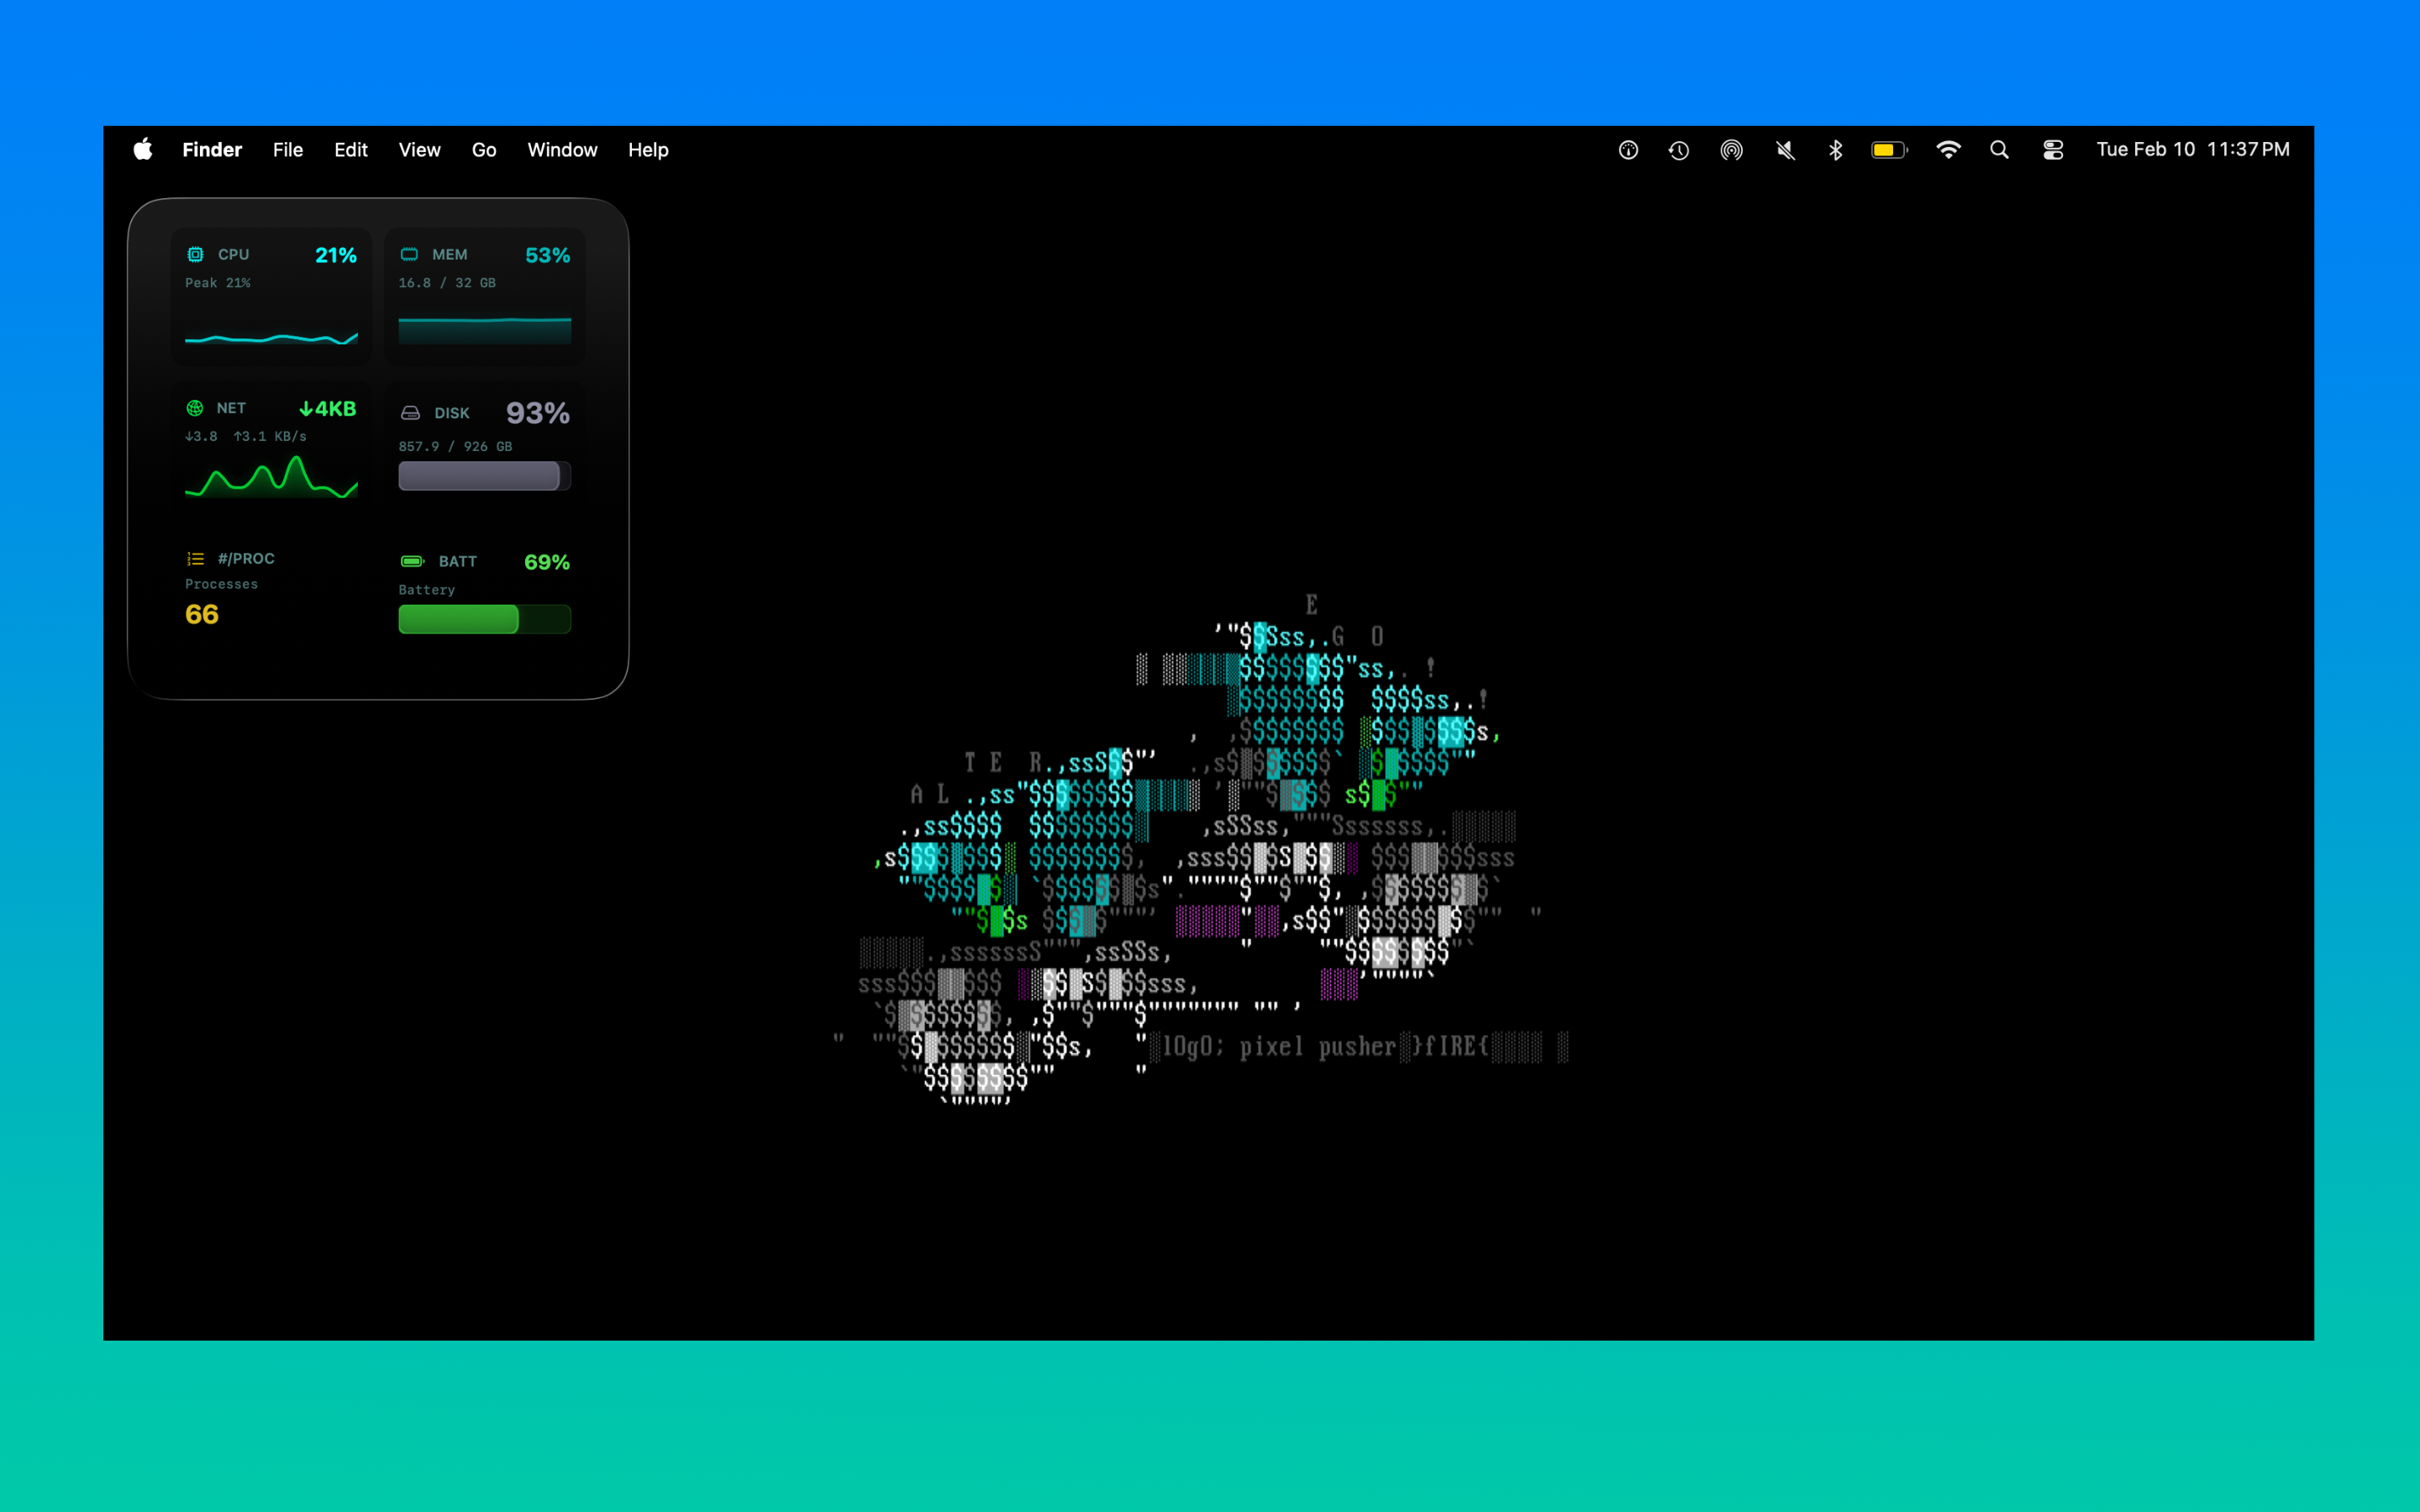
View screenshotPure SwiftUI and WidgetKit. No Electron, no web views. Minimal CPU and battery impact — it monitors your system without burdening it.
View screenshotSupports all WidgetKit sizes.
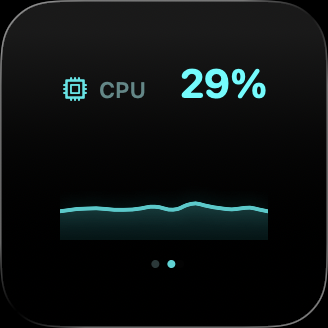
Small
Single metric
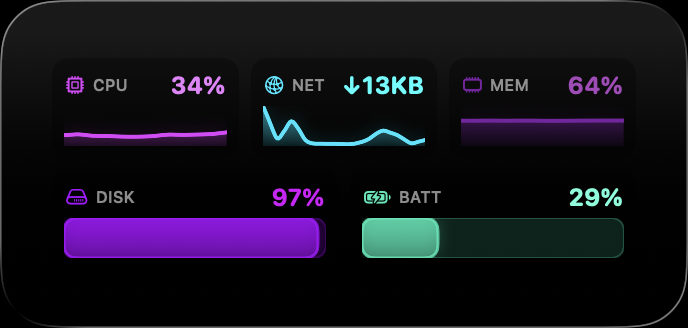
Medium
Multiple metrics at a glance
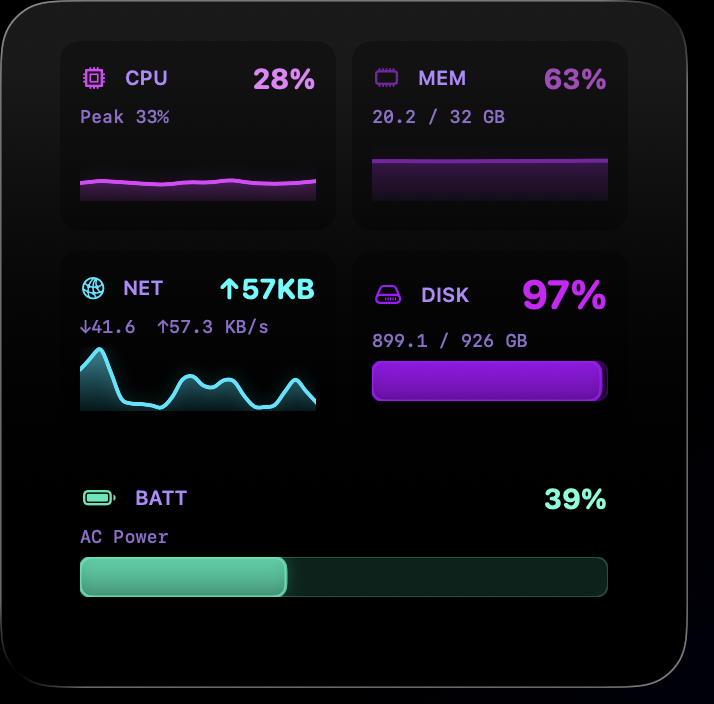
Large
Full dashboard with charts
Dark, native interface designed from the ground up for macOS.
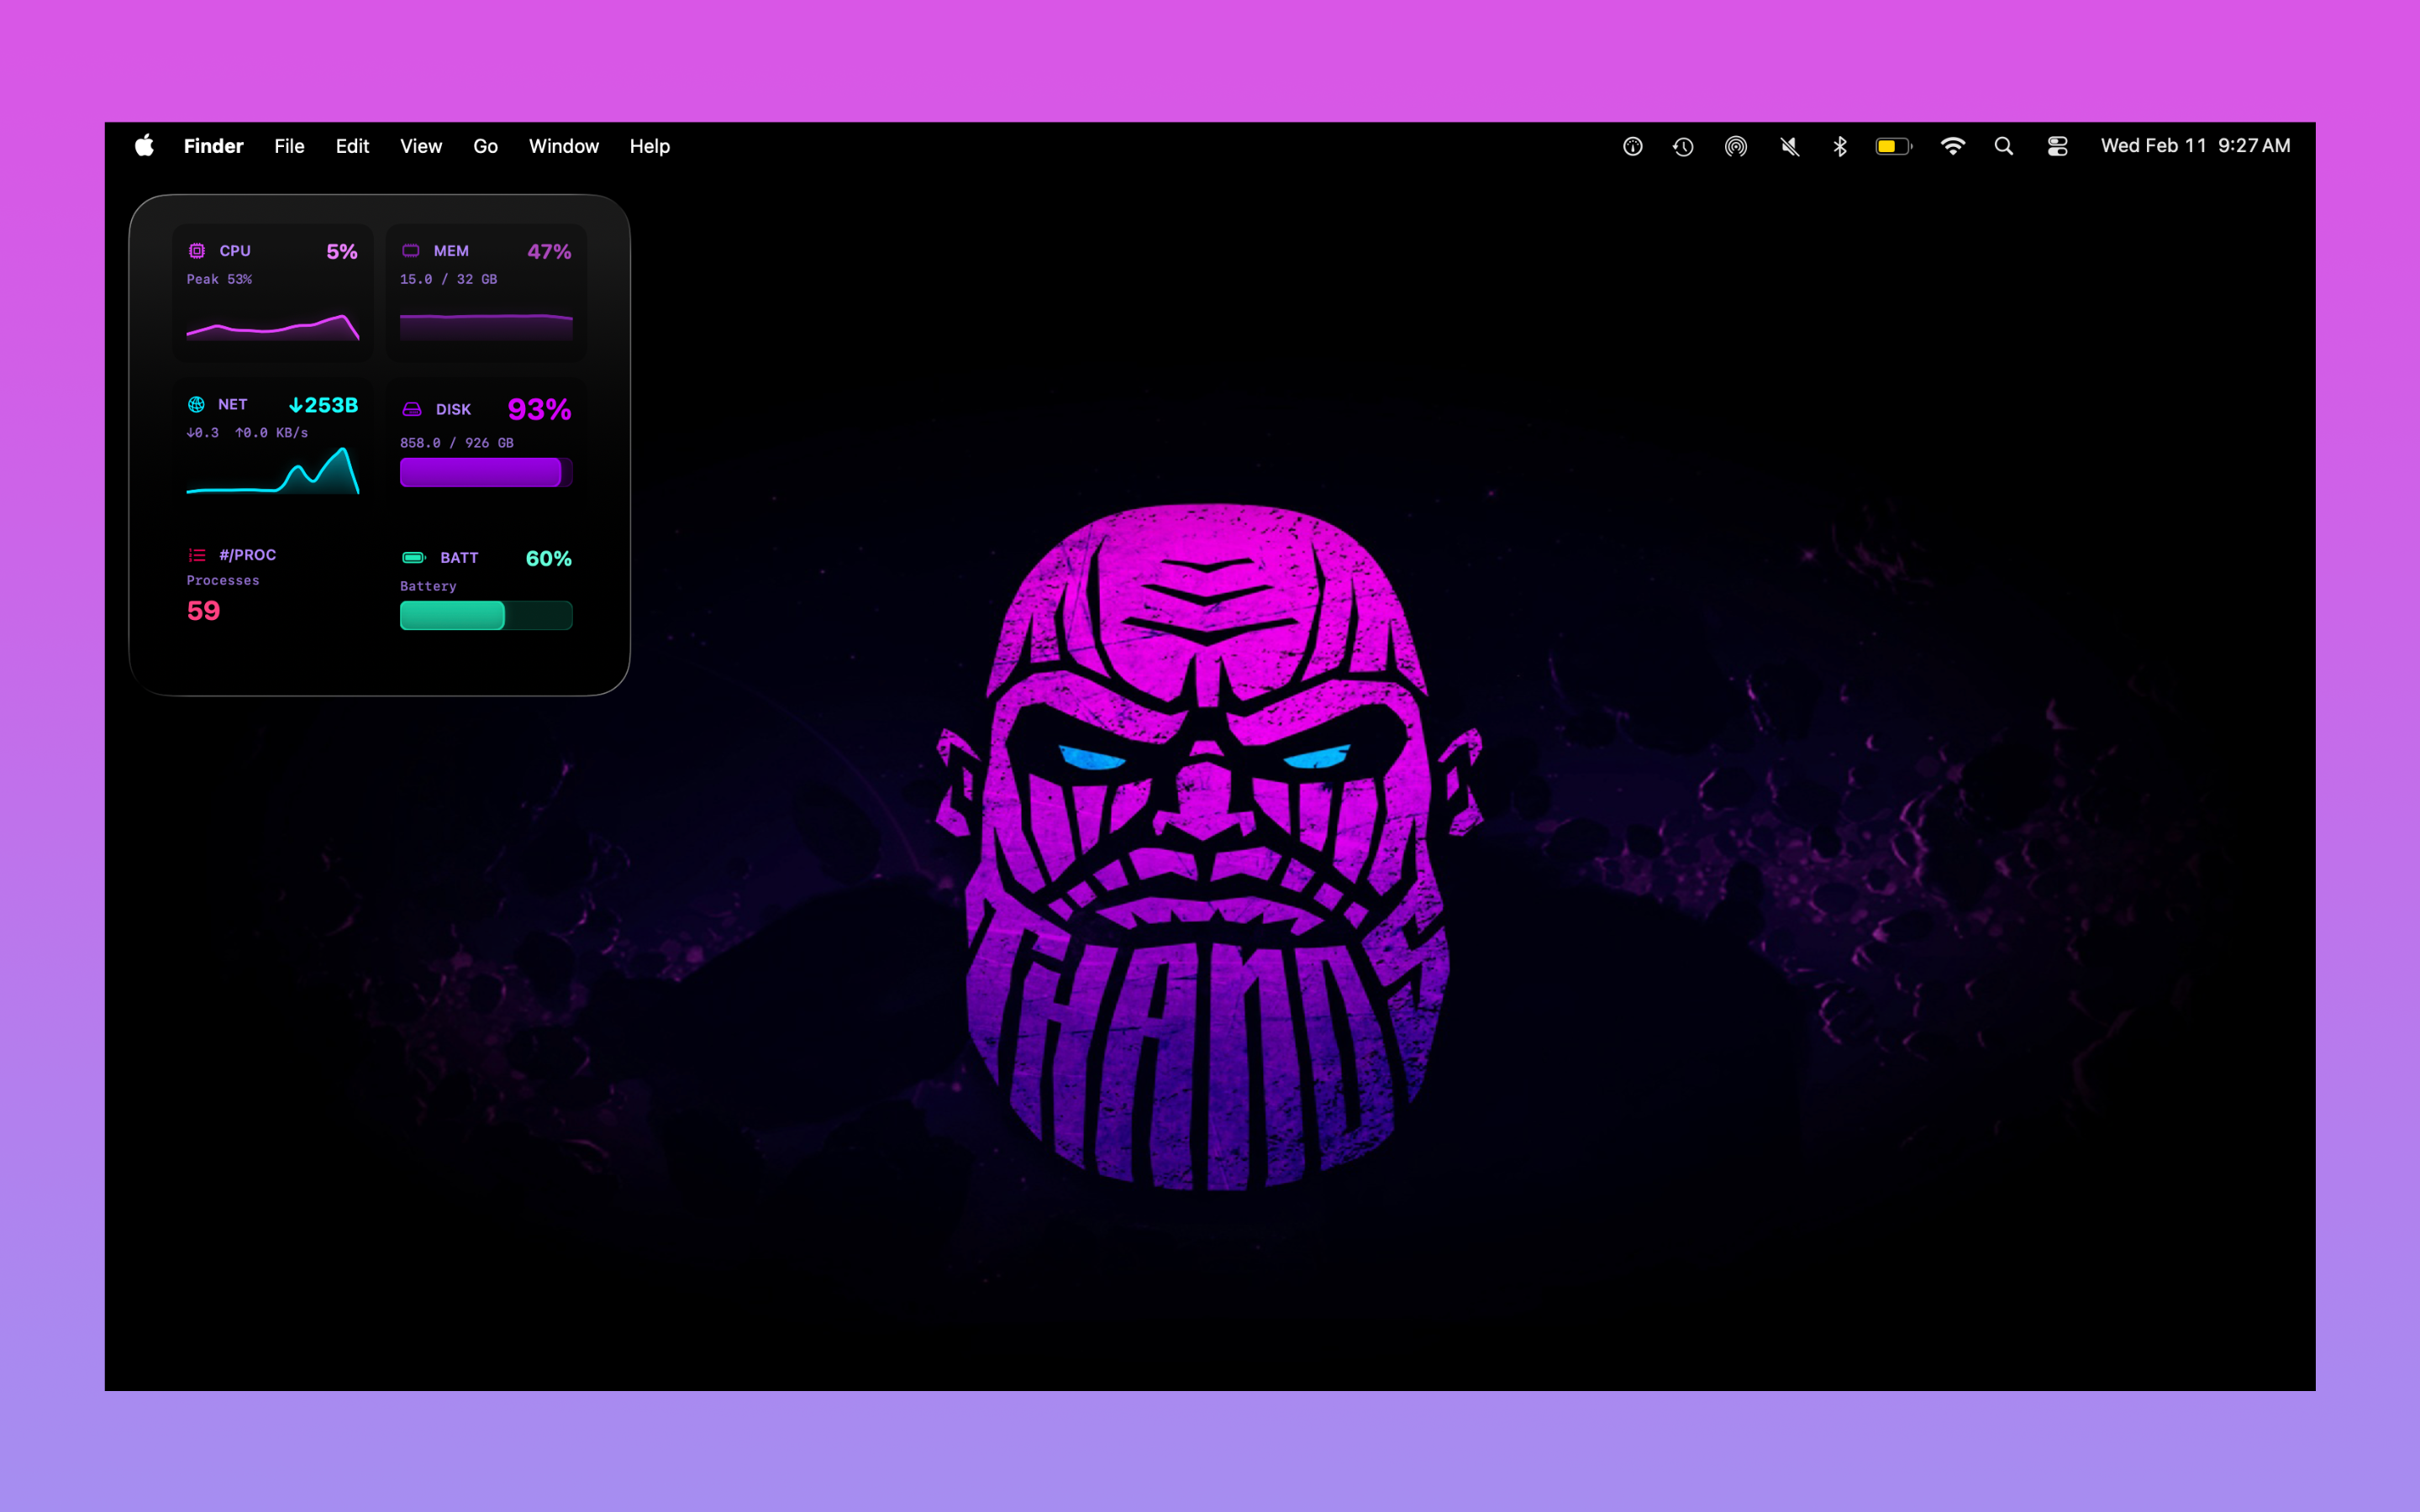
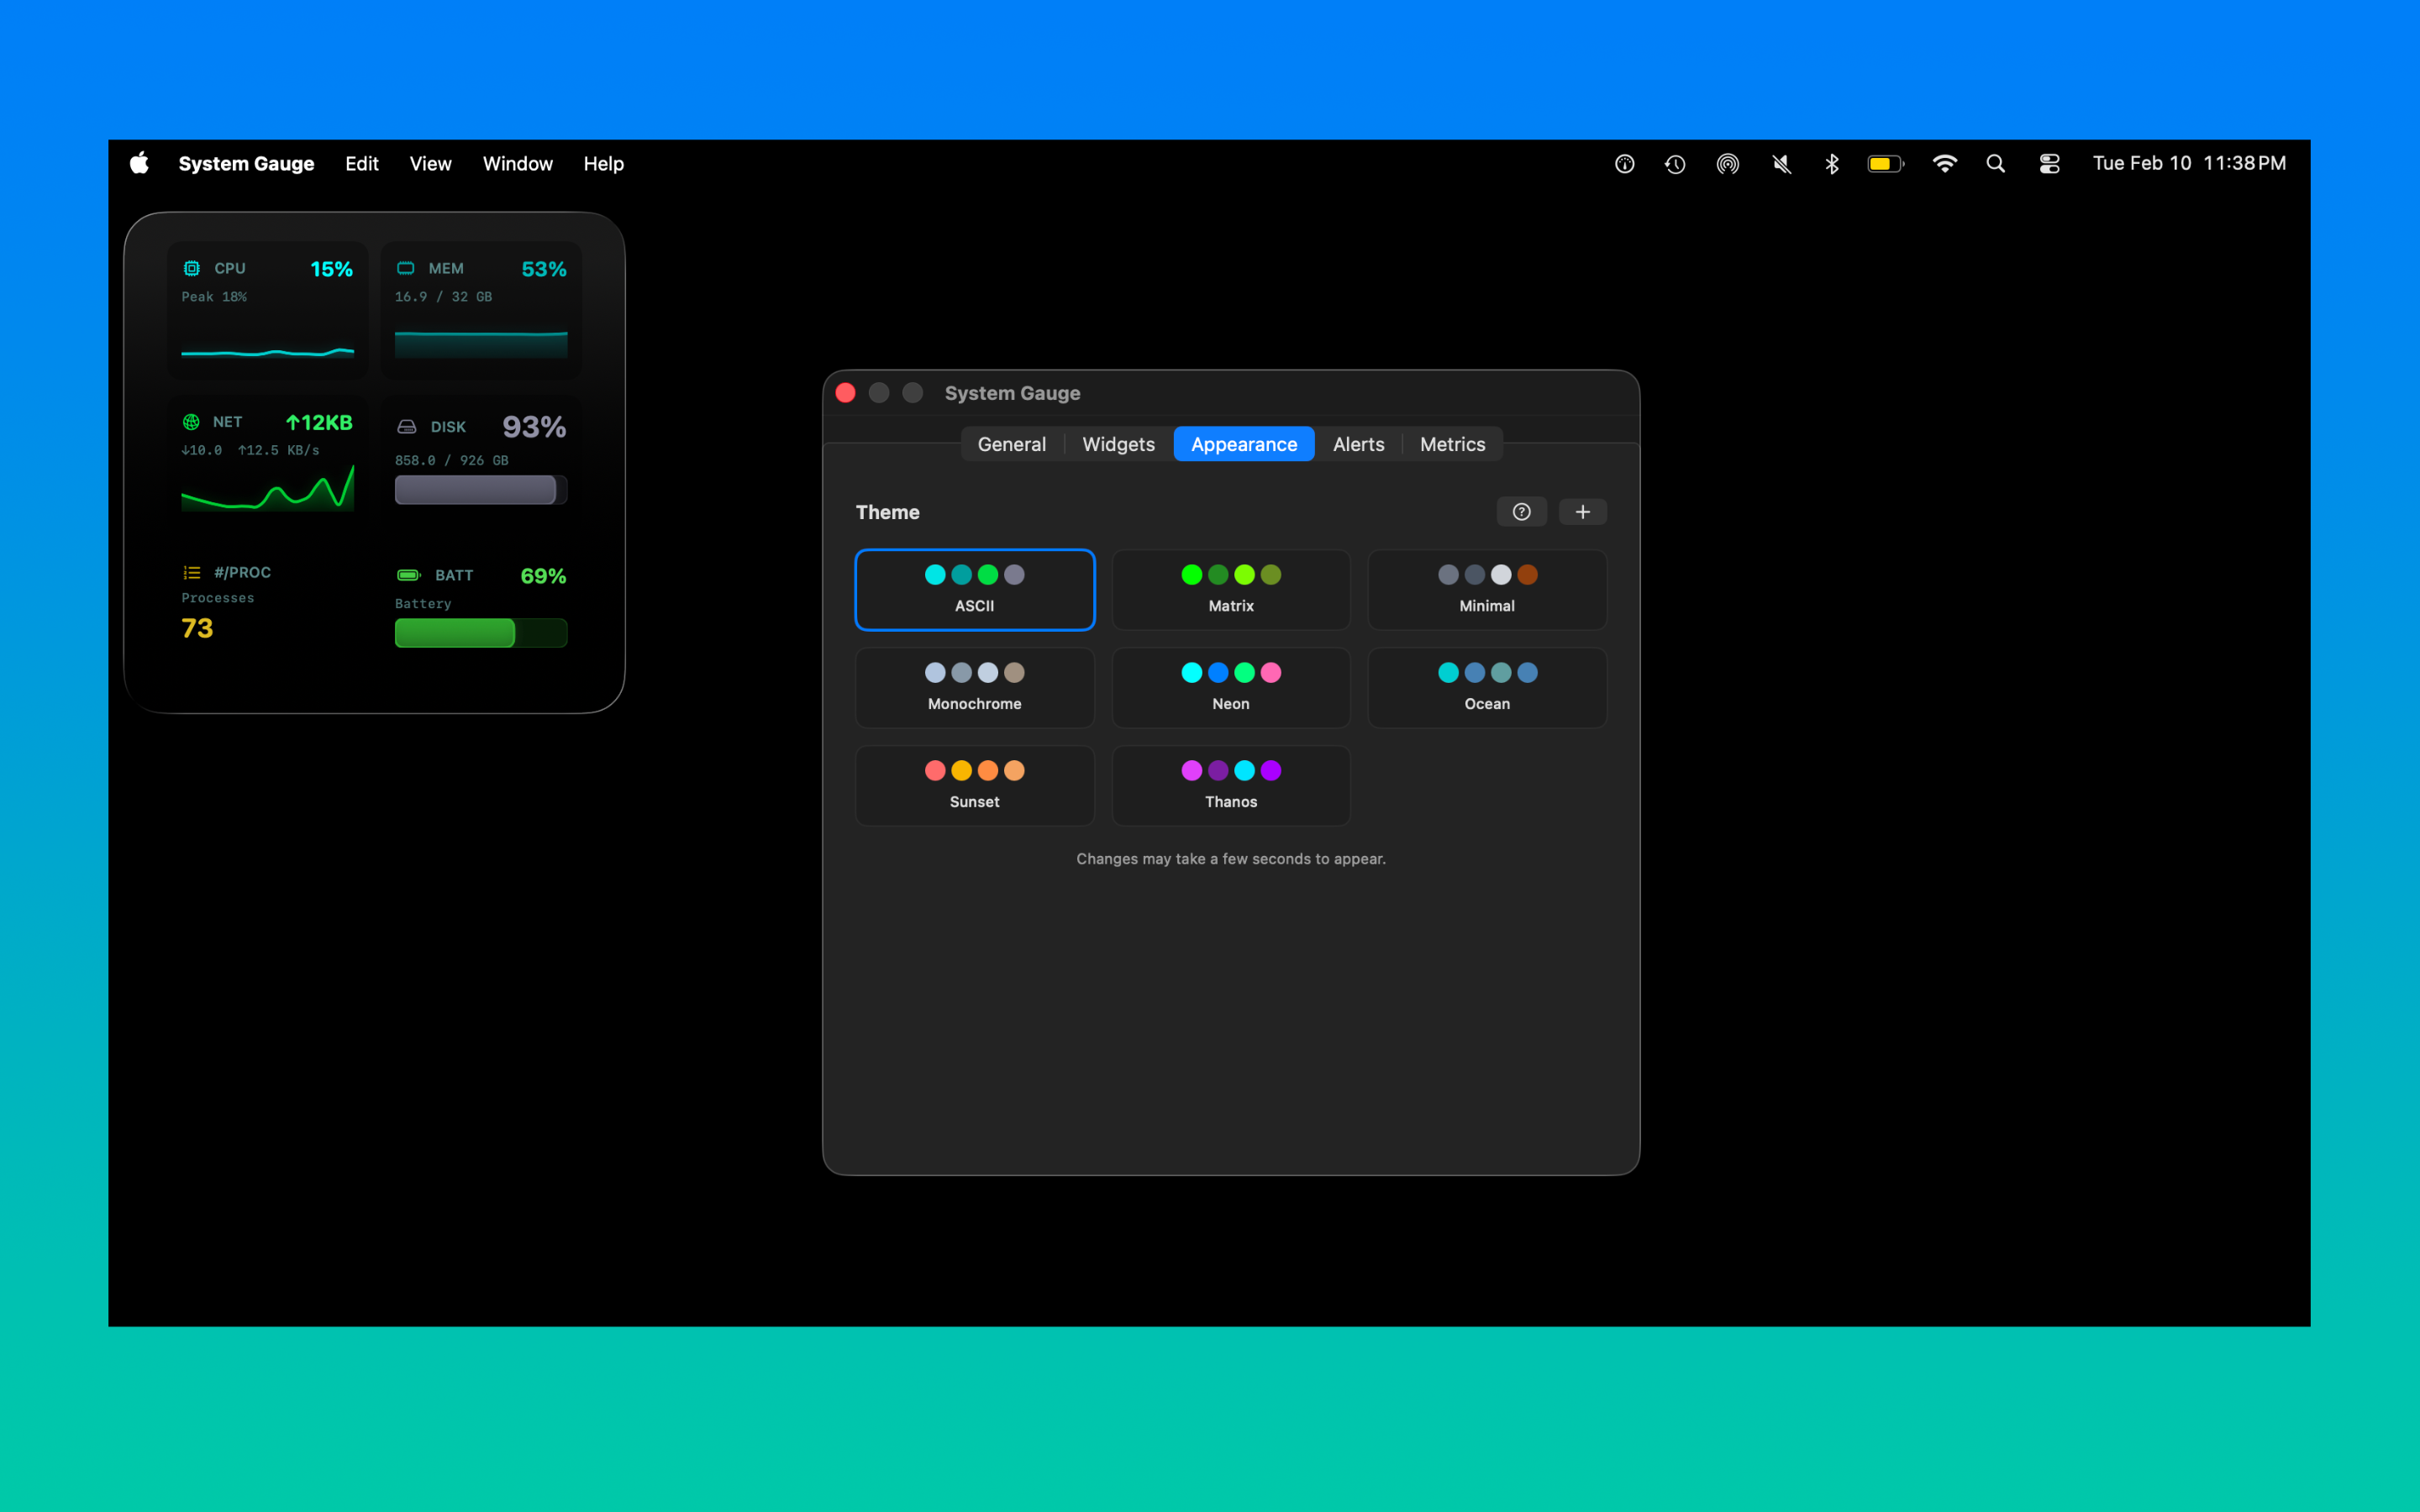
Pick a preset or create your own from scratch. Every theme changes the entire widget palette — colors, accents, and chart fills.
Not limited to presets. Use the built-in theme editor to pick your own colors for every accent, chart fill, and background. Match your wallpaper, your brand, or your mood.
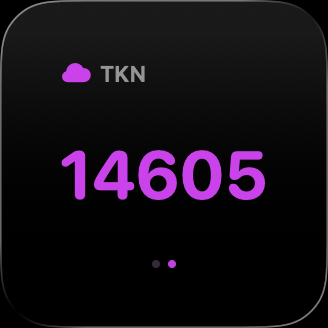
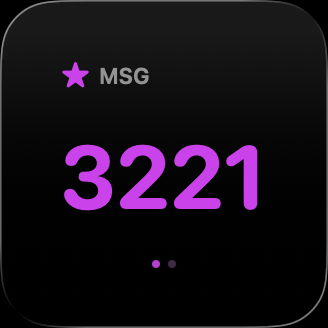
Custom metrics turn System Gauge into a live dashboard for your coding agent spend. Point a widget at a local URL and watch the numbers update on your desktop.
Track consumption across Claude, GPT, Gemini, and any other API. See your burn rate right on your desktop.
Stay ahead of budget overruns. Glanceable cost tracking without switching to a billing dashboard.
Custom metrics read from a URL you provide — run a lightweight local server that exposes your stats, and System Gauge handles the rest. Any data source that can serve a number works.
Cursor, Claude Code, GitHub Copilot — if it burns tokens, System Gauge can track it.
System Gauge monitors CPU usage, memory pressure, network throughput (upload and download), disk space, battery level, thermal pressure, and process count. You can also add custom metrics to track anything else, like AI token usage or API costs.
Yes. Custom metrics fetch data from a URL you configure — typically a lightweight local web server that exposes your stats as a number. System Gauge polls the URL and displays the value in a desktop widget alongside your built-in system metrics. Developers use this to track AI coding agent token usage, API costs, CI pipeline status, and more.
Yes. Set up a simple local web server that exposes your token counts or API spend as a number, then point a custom metric at its URL. System Gauge will display it in a desktop widget that updates automatically. Works with Claude, GPT, Gemini, and any other LLM API — perfect for developers running AI coding agents like Cursor, Claude Code, or GitHub Copilot.
Open System Gauge settings and go to the Widgets tab. Choose small, medium, or large widget sizes. Click any slot to change the metric, and drag slots to reorder. Changes appear on your desktop within seconds.
No. System Gauge is built with native SwiftUI and WidgetKit. It uses minimal CPU and has negligible impact on battery life. Widgets update efficiently through the system's built-in widget scheduling.
System Gauge requires macOS 15 (Sequoia) or later.
System Gauge is a one-time purchase of $4.99 on the Mac App Store. There is no subscription and no additional in-app purchases. All future updates are included.
$4.99 · macOS 15+ · No subscription
Feedback, bug reports, feature requests — we'd love to hear from you.